

If you own a home in Cranford, or if you want to own a home in Cranford, this is the place to be for information about real estate values this summer.
Inventory: There are currently 93 single family homes are currently offered for sale in cranford representing a drop in inventory compared to the summer high of 109 homes. The current listings range in price from $173,900 to $1,275,000. Twenty homes were sold in October at an average sale price of $442,033.
This graph shows inventory and sales for the past 4 years.
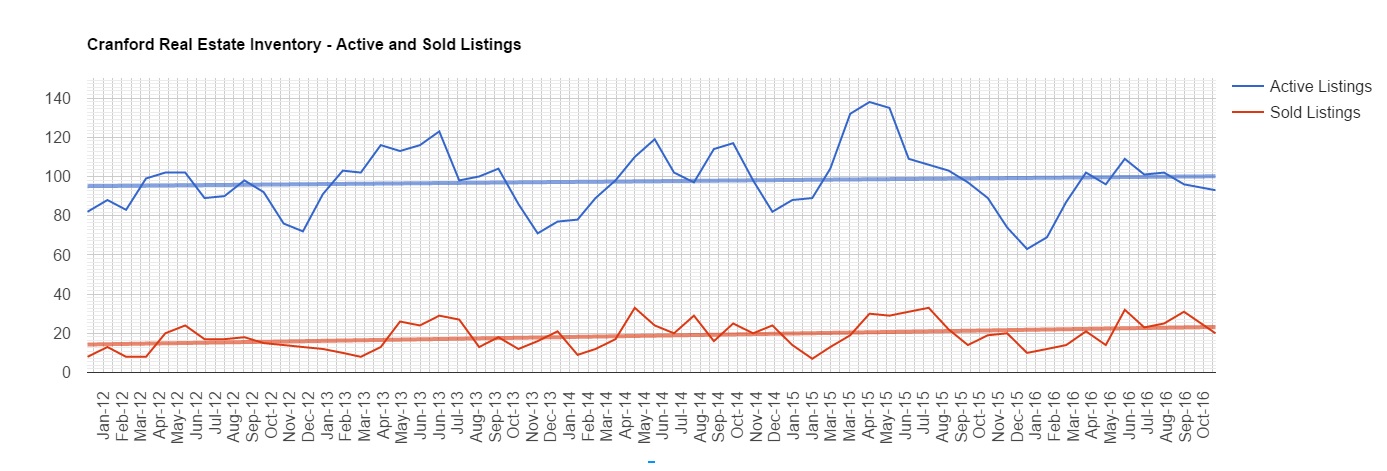
The blue line represents the active inventory in cranford month by month. There are seasonal trends with inventory typically increasing in the summer and decreasing each winter. This summer’s inventory never hit the peak that previous years experienced, largely because homes in Cranford were selling so quickly that the inventory didn’t have a chance to accumulate.
When we look at the trend line for inventory – that’s the darker blue straight line on the graph – we see a gradual increase showing an increase of about 5% over 4 years.
The red line at the bottom of the graph shows the number of sold listings over the past 4 years showing a 5% increase over time. When the inventory and sold listings keep pace with each other like they do in Cranford, you keep a steady supply of homes being offered for sale and being bought year round.
Prices: In October of 2016, the average sold home was sold for $442,033, slightly down from the previous month and about 3% higher than the 12 month average of $428,697.
The graph for Cranford sale prices shows seasonal variability which isn’t a concern but the month to month variability indicates a little instability. What’s good to note is that winter sales, while still low, are higher in recent years than they were several years ago and summer sales peaks are also higher in recent years than several years ago.
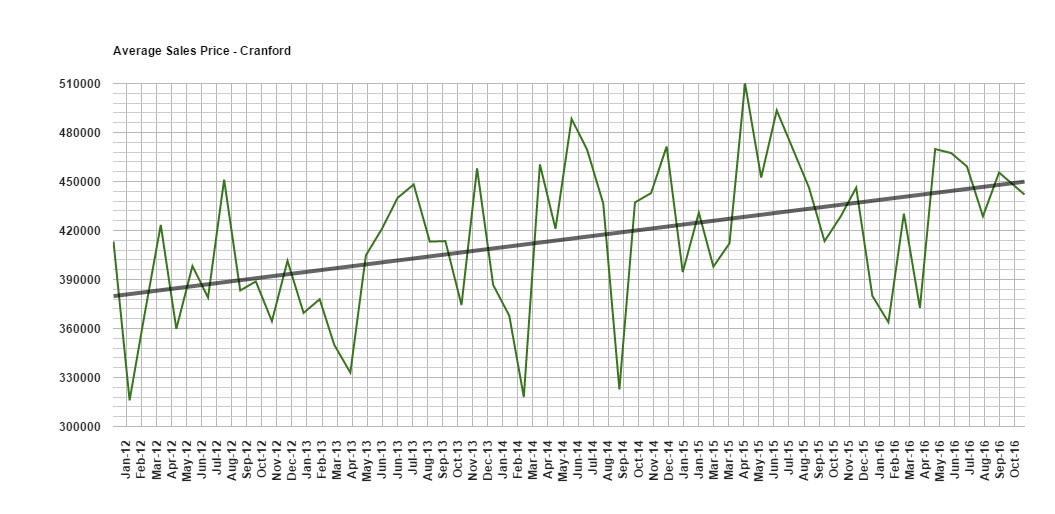
That is represented on this Trend line which is that straight black line in the graph. It is showing a very healthy increase in prices over the past several years. Prices 4 years ago were around $380,000 and now they’re closer to $445,000.
Days on Market: Of course, the length of time it takes to sell a home depends on far more than just location. It is also dependent on price, condition, and marketing.
In October of 2016, the average sold home in Cranford was sold after 40 days – hardly more than a month as an active listing. This is exceptionally fast for this time of year. October 2015 and October 2014 home sales both averaged at 59 days.
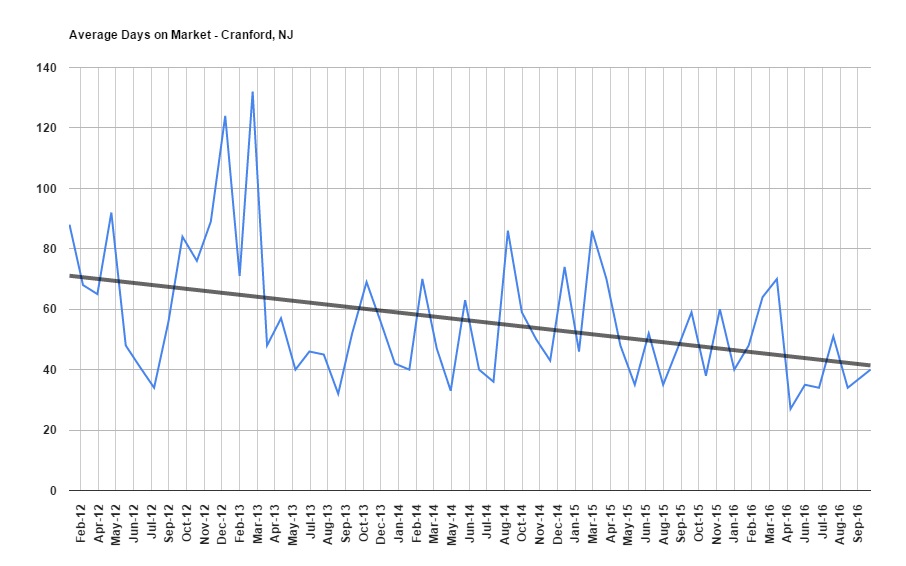
You can see on the graph that home sales in Cranford aren’t just fast but they’re also getting faster.Looking at the trend line – the black straight line on the graph- homes in cranford homes sold back in january of 2012 after about 70 days on the market and now they’re selling significantly faster than that, trending at around 41 days.
If your next step is selling your Cranford home, call us today at 908-917-4198 for your free comparative market analysis and see how your home compares to others in Cranford.