


Let’s take a look at how the real estate market in Clark performed in September of 2019.
Inventory:
In September , 16 single family homes were sold and 106 homes were offered for sale, up from 94 homes offered for sale in September of 2018 and compared to the 12 month average of 97 homes offered for sale. To search for listings, please click here.
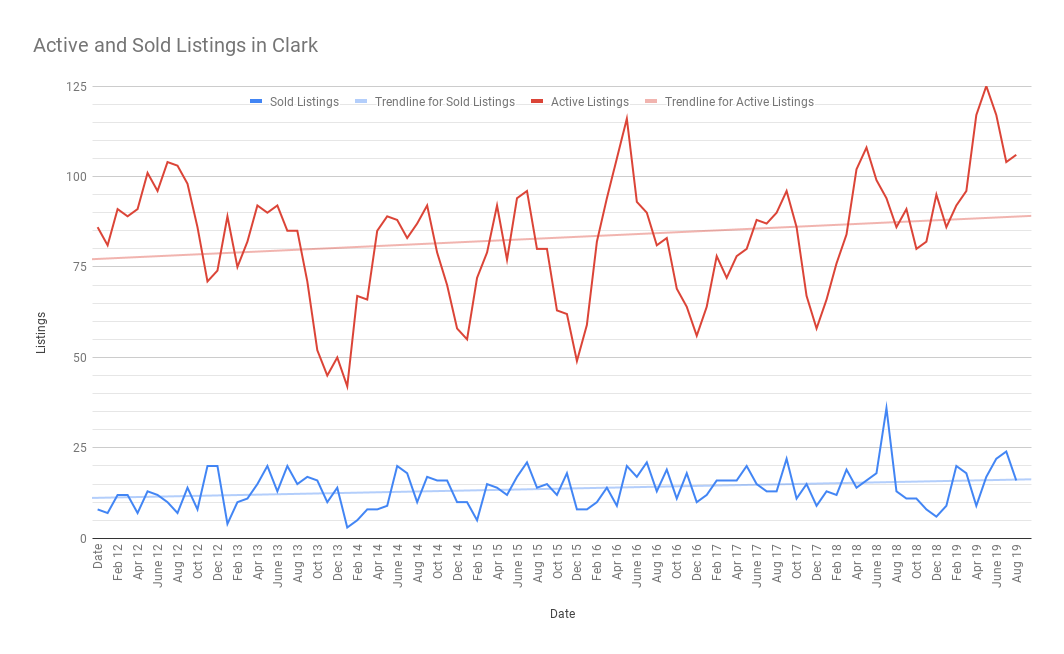
More homes are offered for sale in the spring and summer than in the winter which explains the peaks and valleys in the red line above, the active listings over the last 6 years. The blue line represents sold listings in Clark over the last 6 years and the straight light blue line represents the trend in sales, eliminating the monthly variation and showing a long term trend of upwards sales. Buyers find Clark attractive, and homeowners benefit in the form of increasing sales prices and decreasing days on market.
Many forecasters are predicting a turn around in the real estate market and are expecting a busy winter. Factors such as existing and pending home sales and buyer traffic indicate that we may be headed for a rebound.
Prices:
Home ownership continues to be the largest indicator of personal net worth in the United States.
The average list price in Clark in September was $517,913 (compared to $559,212 in September of 2018) and the average sale price was $404,959 (compared to $548,192 in September of 2018). This month’s dip in prices is at least in part due to a ow number of sales – only 16 sales in September compared to 24 in August and 22 in July.
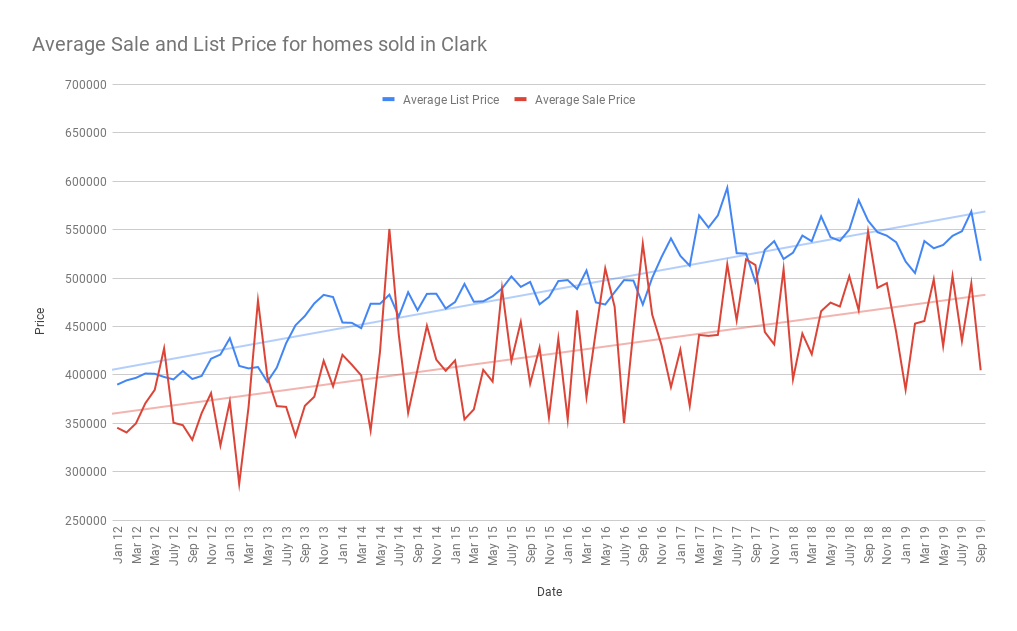
When you look at the graph of home prices in Clark, it’s obvious that there are tremendous variations from month to month. As a rule, prices are higher in the summer and lower in the winter due to supply and demand, but of course there are exceptions to this rule. One exception is extreme homes – those that sell for far below or far above the typical home sale in Clark. Short sales, foreclosures and homes in disrepair often sell for less than market average. The important thing to note in the graph are the straight lines which represents the long term trend, eliminating the seasonal variability and the variability brought on from extreme cases. The trend line continues to show a healthy improvement in prices in Clark over the past 7 years and the forecast is for prices to continue to increase. Homeowners are likely to see an increased return on investment as time goes on.
Days on Market:
One of the questions we’re asked most often is how long it takes to sell a home in Clark. The average sold home in Clark in September was sold after only 45 days on the market, slightly slower than the 12 month average of 41 days. Buyers who are out and looking for houses are ready to make a move quickly, but the heat of the summer market has cooled off a bit!
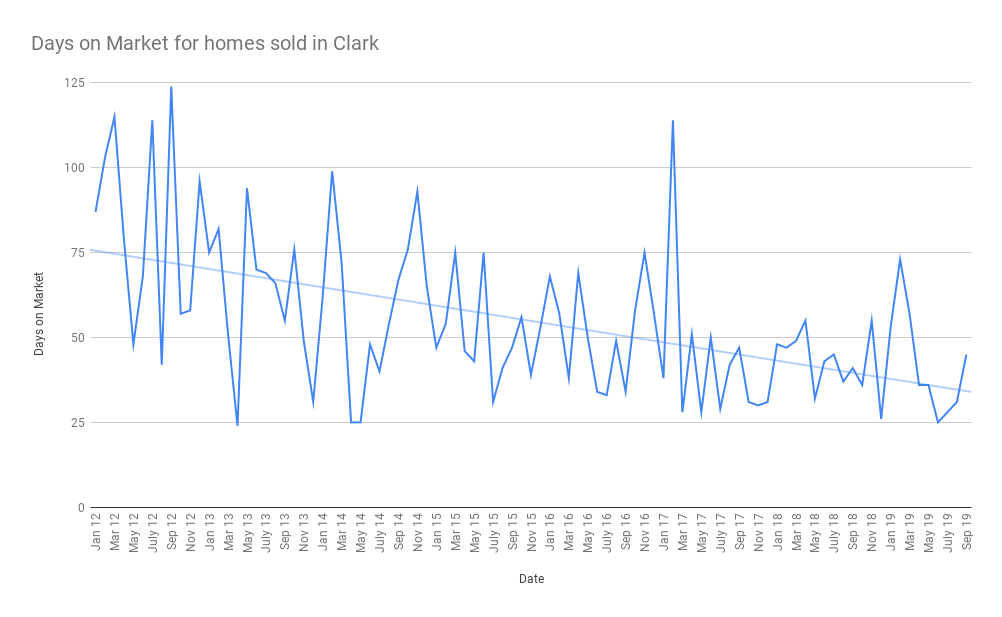
Of course, there are exceptions to this rule and the graph’s dramatic variations are indicators of this. Seasonal variability often results in longer DOM in winter and shorter in summer, but the overall trend line above eliminates that seasonal variability.
Homes sell faster when they are:
- In pristine updated condition,
- Are marketed aggressively, and
- Are priced correctly.
To learn what this means to buyers and sellers, please click here.
To read more about the real estate market in Clark, please read our earlier market reports here. For more information on how Team Zuhl can help you, please click here or call us at 908-917-4189.