

Before you buy a home or sell a home in Clark, it’s important to first understand how current market conditions compare to past market conditions and what that means for the future. Here’s what you need to know for October, 2016.
Inventory: There are currently 71 homes offered for sale in Clark. This is the lowest inventory we’ve seen in Clark since spring and is not unusual for this time of year and comes after a record high inventory in June of 106 homes. There were 12 homes sold in Clark in September.

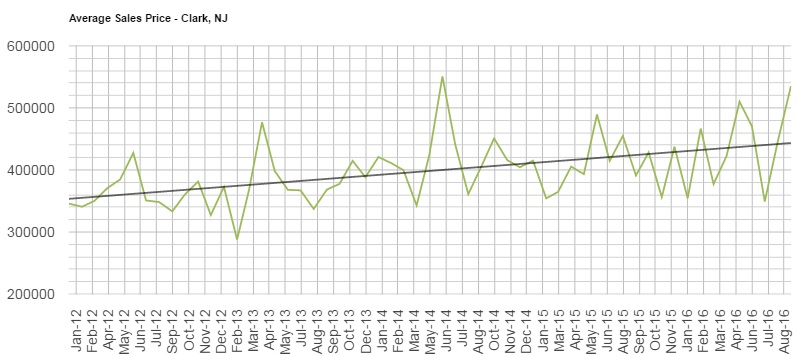
Prices: The average home that was sold in Clark in September was sold for $535,083 which is the highest monthly sale price since June of 2014. The 12 month average sale price in Clark is $429,449. Clark prices continue to rise overall as shown in the dark green trend line in the graph below.
Days on Market: The average number of days a home in Clark was offered for sale before being under contract was 37 days in September compared to a 12 month average of 48.5 days. Even as inventory shrinks, the demand for homes in Clark continues to rise.
For more information on selling a home:

All opinions, information and data provided is deemed reliable but is subject to errors and omissions. Not intended to solicit other Brokers’ clients. We cooperate with them fully.