

If you own a home in Fanwood, or if you want to own a home in Fanwood, this is the place to be for information about real estate values this winter.
Inventory: There are currently 34 single family homes offered for sale in Fanwood which is normal for this time of year – November 2015 had an inventory of 35 homes and November of 2014 had an inventory of 32 homes. The current listings range in price from $249,900 to $659,000. Six homes were sold in October at an average sale price of $323,667.
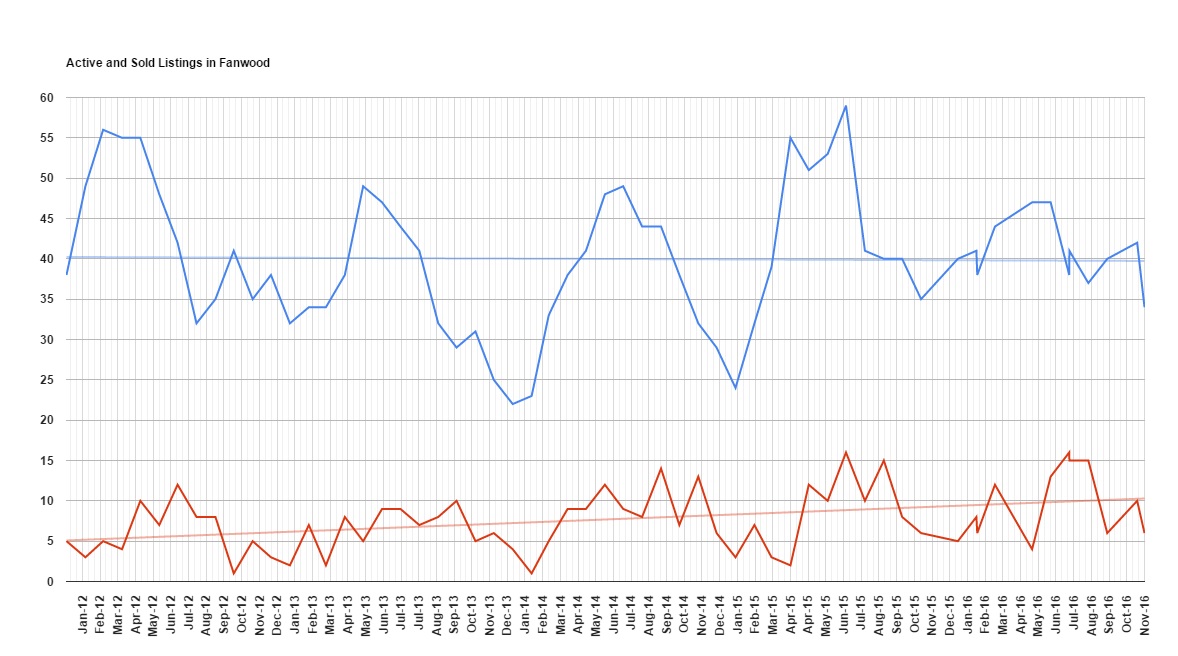
This graph shows inventory and sales for the past 4 years.
The blue line represents the active inventory in Fanwood month by month. There are seasonal trends with inventory typically increasing in the summer and decreasing each winter. This summer’s inventory never hit the peak that previous years experienced, largely because homes in Fanwood were selling so quickly that the inventory didn’t have a chance to accumulate.
When we look at the trend line for inventory – that’s the darker blue straight line on the graph – we see inventory hasn’t changed measurably over the past 4 years.
The red line at the bottom of the graph shows the number of sold listings over the past 4 years showing a 100% increase over time. In other words, twice as many homes are being sold now per month than was typical four years ago.
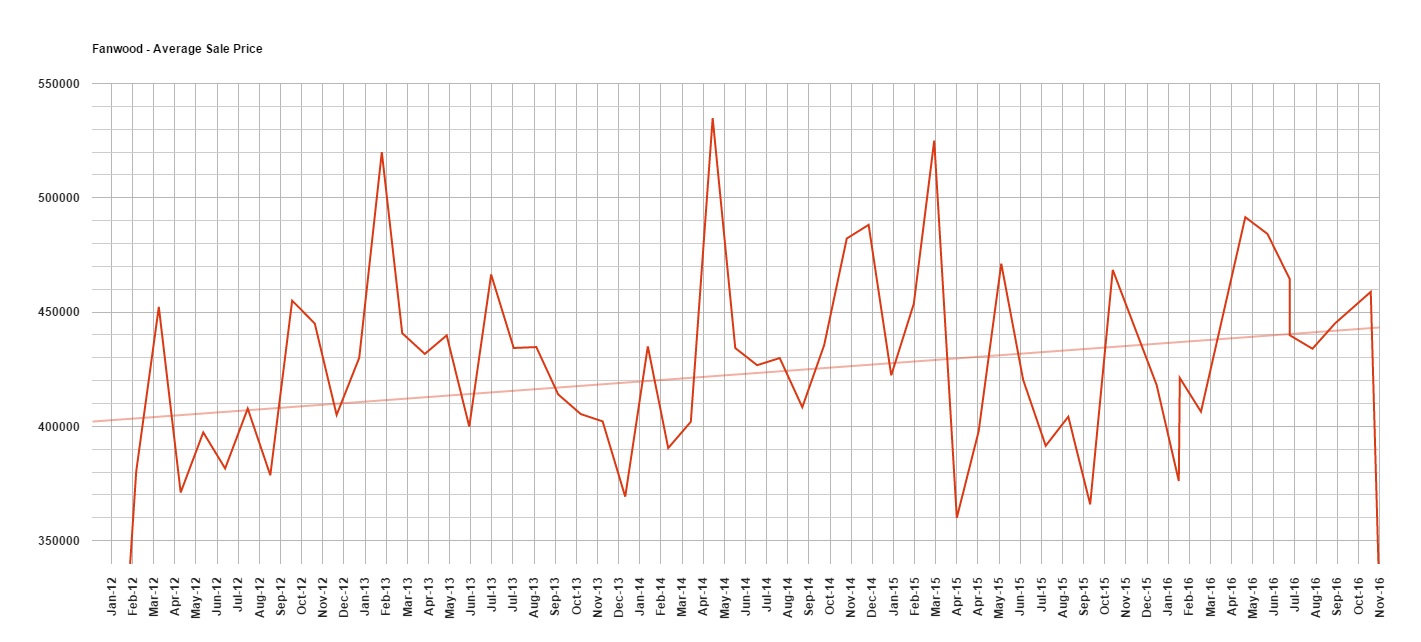
Prices: In November of 2016, the average sold home was sold for $323,667, well below the 12 month average of $430,282. In part, this is explained by the low number of sales in Fanwood. Since only six homes were sold, if one home is sold at a very low price, it can lower the average a great deal. The opposite is also true – a high priced sale can raise the average a lot, so monthly average sale prices in Fanwood are not a good indicator of the strength of the real estate market except when viewed over long periods of time.
The graph for Fanwood sale prices shows us a long term improvement in home sale prices. The straight light red line in the graph is the trendline and is shows a very healthy increase in prices over the past several years. Prices 4 years ago were around $400,000 and now they’re closer to $440,000 – a 10% increase over 4 years.
Days on Market: Of course, the length of time it takes to sell a home depends on far more than just location. It is also dependent on price, condition, and marketing.
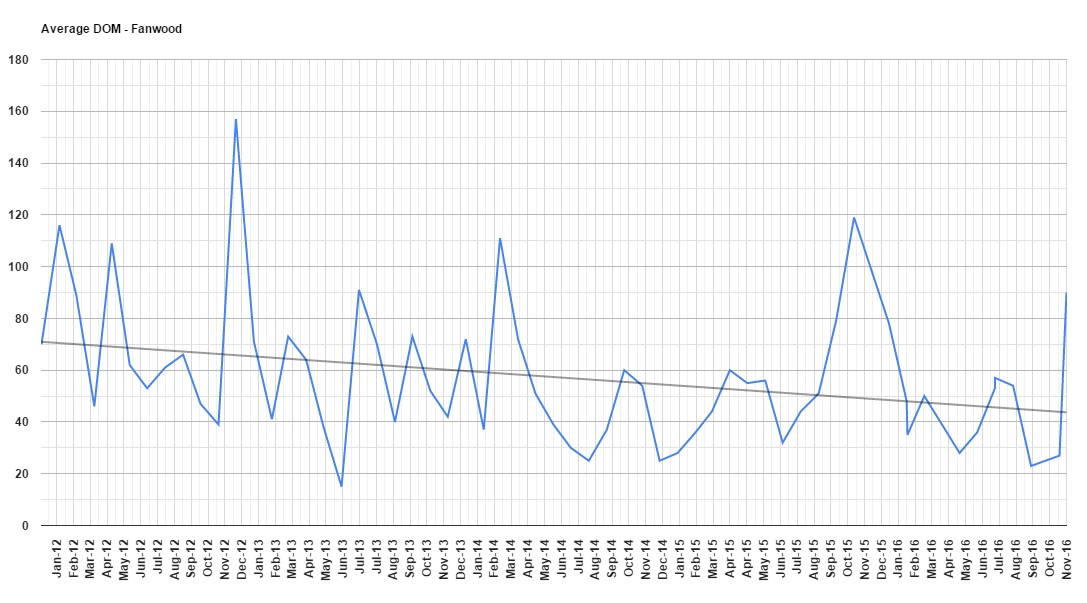
In November of 2016, the average sold home in Fanwood was sold after 90 days. This is an unusually long time for Fanwood – the twelve month average is only 48 days, for example. This further helps to explain the lower than typical average sale price. One home was sold in Fanwood in November that had been on the market for a long time and sold far below the typical price in Fanwood and, since only six homes were sold, that impacts the average a great deal.
A bigger picture can be seen by looking at the trendline in the graph. Homes in Fanwood homes sold back in January of 2012 after about 71 days on the market and now, even with an unusually slow November, they’re trending at around 44 days.
If your next step is selling your Fanwood home, call us today at 908-917-4198 for your free comparative market analysis and see how your home compares to others in Fanwood.