
Cranford remains one of the most sought after towns in Union County. Here’s what’s been happening in the Cranford real estate market this summer.
Inventory at the end of July:
| Active Listings | Sold homes | |
| End of July 2019 | 123 | 47 |
| End of June 2019 | 126 | 24 |
| End of July 2018 | 86 | 16 |
| 12 month average | 102 | 21.7 |
There were 123 homes offered for sale in Cranford in July compared to the 12 month average of 102 homes. 47 homes were sold in July compared to the 12 month average of 21.7 homes. This big jump in homes sold this month helps reduce the high inventory we’ve had for a few months and should make it a little easier to sell your Cranford home this fall.
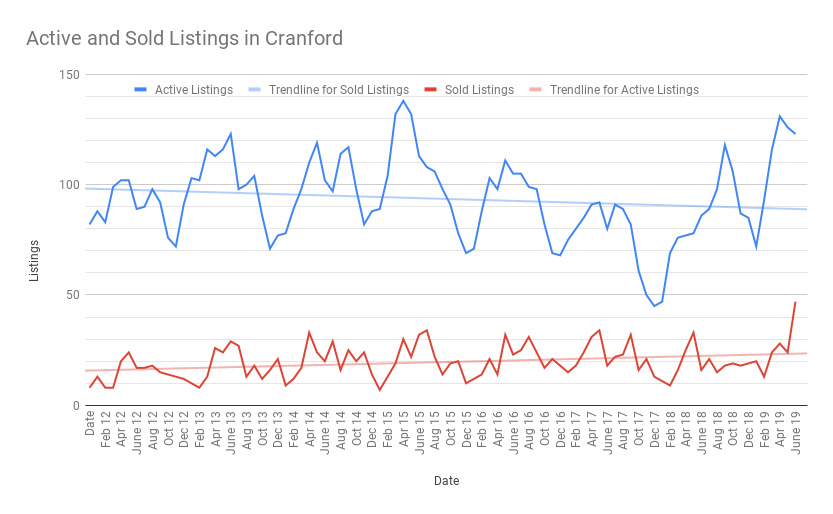
Inventory and sales are variable monthly as shown by the peaks and valleys in the graph above. Some variability can also be attributed to homes that are more desirable or less desirable than the average Cranford home. Homes that are in exceptional condition or well priced won’t stay on the market long, whereas distressed properties or homes in disrepair stay around longer and cause data variations. Even conditions such as weather affect home sales – fewer buyers are out looking on days that are oppressively hot or rainy.
Realtors use an analysis called Months of Inventory to evaluate the real estate market. The Months of Inventory is equal to how long it would take to sell the existing inventory if no new houses were put on the market. When the Months of Inventory is below four months, realtors call it a seller’s market because the supply is relatively low so sellers have a stronger position in negotiations between a buyer and a seller. When the Months of Inventory is above seven months, realtors call it a buyer’s market because the supply is relatively high and buyers have a stronger position in negotiations. Months of Inventory between four and seven is considered a normal market with a good balance of buyers and sellers.
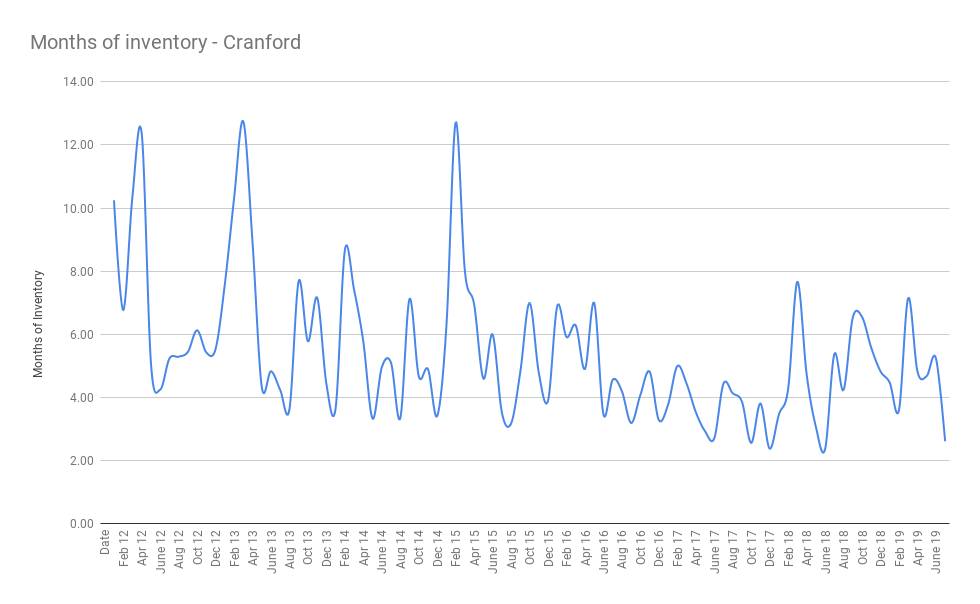
Despite a weak seller’s market for 2017 and the first half of 2018, Cranford currently has a strong seller’s market with fewer homes offered for sale than can sustain the current rate of buying. This should result in quicker sales and/or higher prices leading in to the fall.
Prices
| Average Sale Price |
Average List Price
|
|
| July 2019 | $493,622 | $556,989 |
| July 2018 | $602,000 | $544,675 |
| 12 month average | $544,622 | $496,881 |
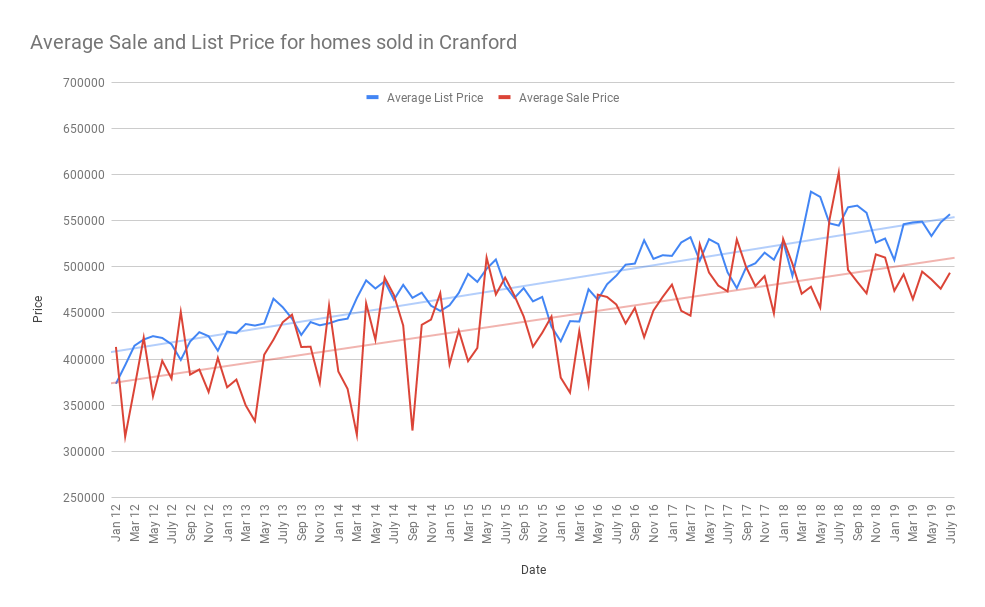
The important thing to note about the graph is not the variability but rather the overall long term trend which is represented by the straight black line which shows a healthy increase in home list prices and sale prices in Cranford over the past seven years.
Days on Market
| Days on Market | |
| July 2019 | 34 |
| July 2018 | 34 |
| 12 month average | 38.3 |
Summer sales are usually brisk whereas winter sales tend to slow down. Homes that are in better condition, are priced better, or are marketed more strongly tend to sell faster.
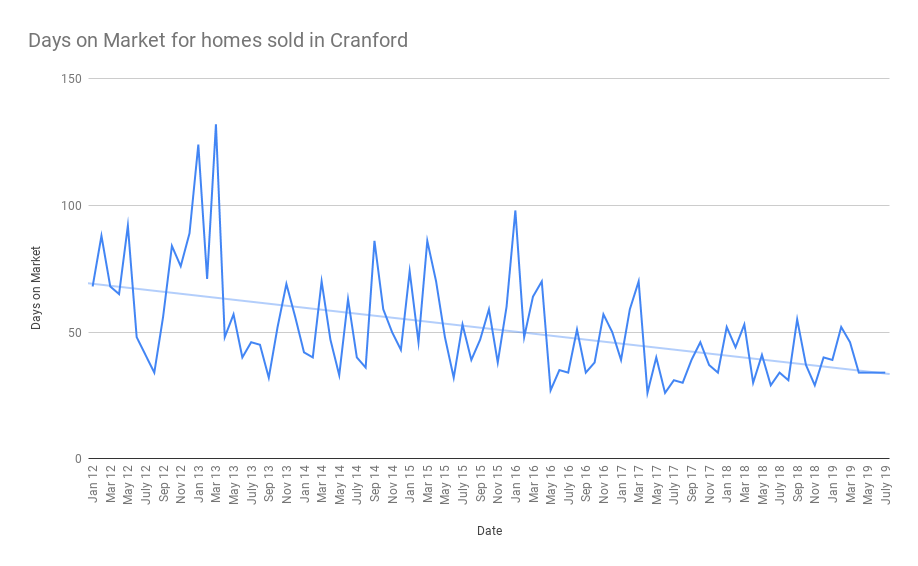
The overall trend line in this graph shows a strong decrease in days on market in Cranford going back seven years.
What this means for buyers:
- Be educated. Learn what kind of home you want. Decide with your family members what you need in a home and what you want in a home.
- Be informed. Spend some time getting to know the inventory. Learn what homes look like in your price range. Learn what home features you can afford.
- Be ready. Have your pre-approval ready so that you can act quickly when you find your perfect home.
What this means for sellers:
- If you’re on the fence about selling your home, this may be the perfect opportunity to get the most money in the shortest amount of time.
- Even in a shrinking inventory situation, you’re still competing with other homes on the market. View the other homes that are offered for sale and make sure your home is the best one in its price range.
- Make your home available for potential buyers.
To read more about the real estate market in Cranford, please read our earlier market reports here. For more information on how Team Zuhl can help you, please click here or call us at 908-917-4189.