


Let’s take a look at how the real estate market in Clark performed in February.
Inventory:
In February, 11 single family homes were sold and 71 homes were offered for sale in Clark. This is the lowest active inventory seen in Clark since February of 2018. Low inventory often occurs as the days get shorter and this drop can be explained, at least in part, to seasonal variability. To search for listings, please click here.
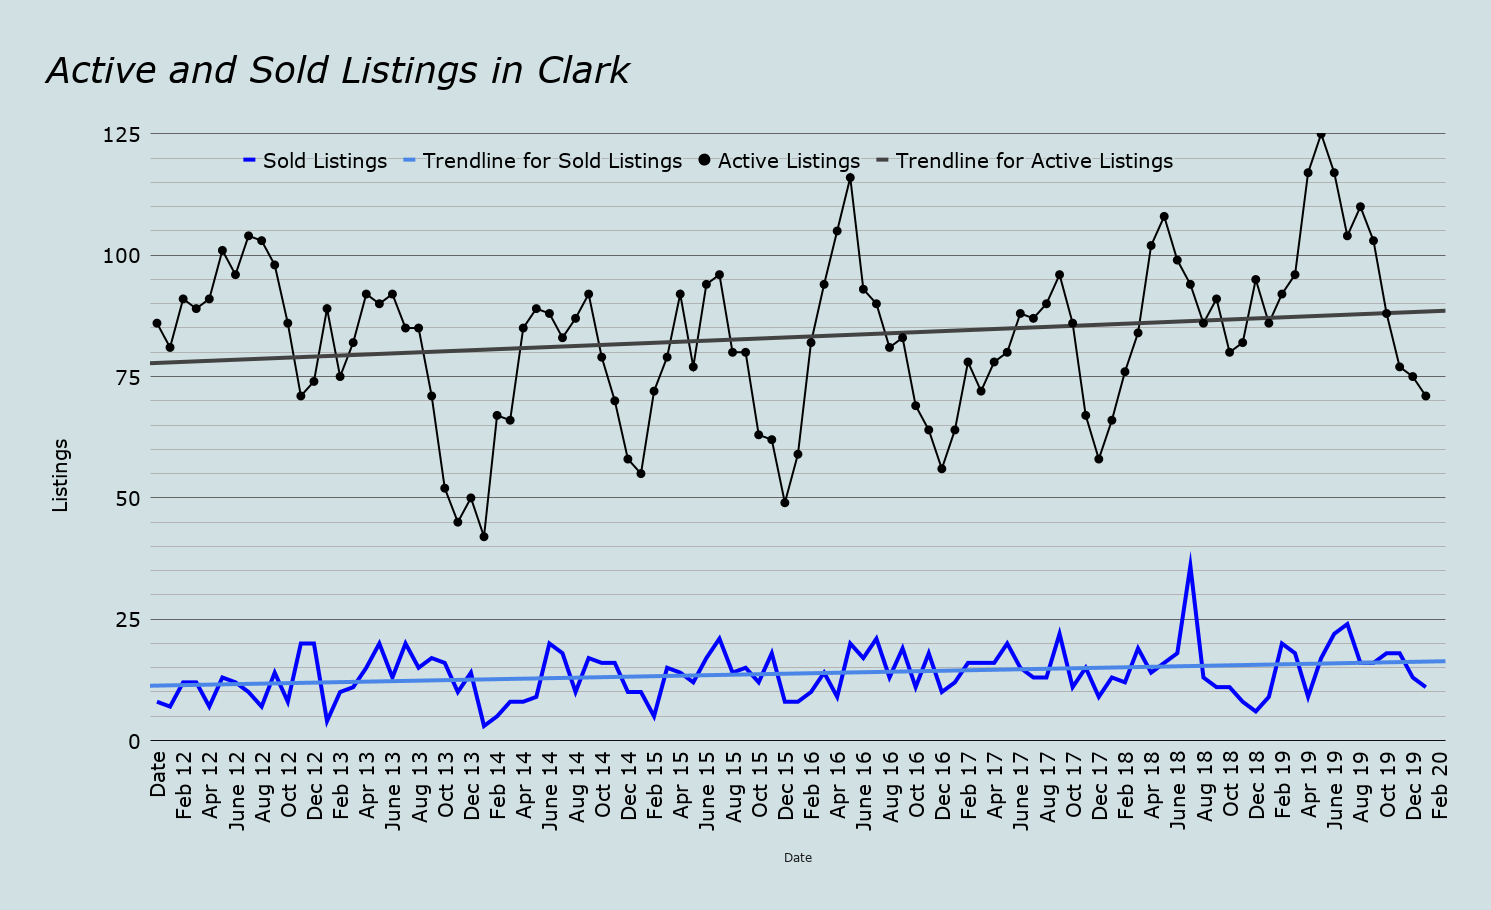
More homes are offered for sale in the spring and summer than in the winter which explains the peaks and valleys in the black line above, the active listings over the last 7 years. The blue line represents sold listings in Clark over the last 7 years and the straight blue line represents the trend in sales, eliminating the monthly variation and showing a long term trend of upwards sales. Buyers find Clark attractive, and homeowners benefit in the form of increasing sales prices and decreasing days on market.
The data shows that Clark is currently experiencing a normal market with low (and decreasing) inventory. There are currently 6.45 months of inventory available in Clark. If no other homes came on the market, the inventory would be 0 in 6.45 months.
Prices:
The average list price in Clark in February was $524,900 (compared to $505,227 in February of 2019) and the average sale price was $490,591 (compared to $453,056 in February of 2019).
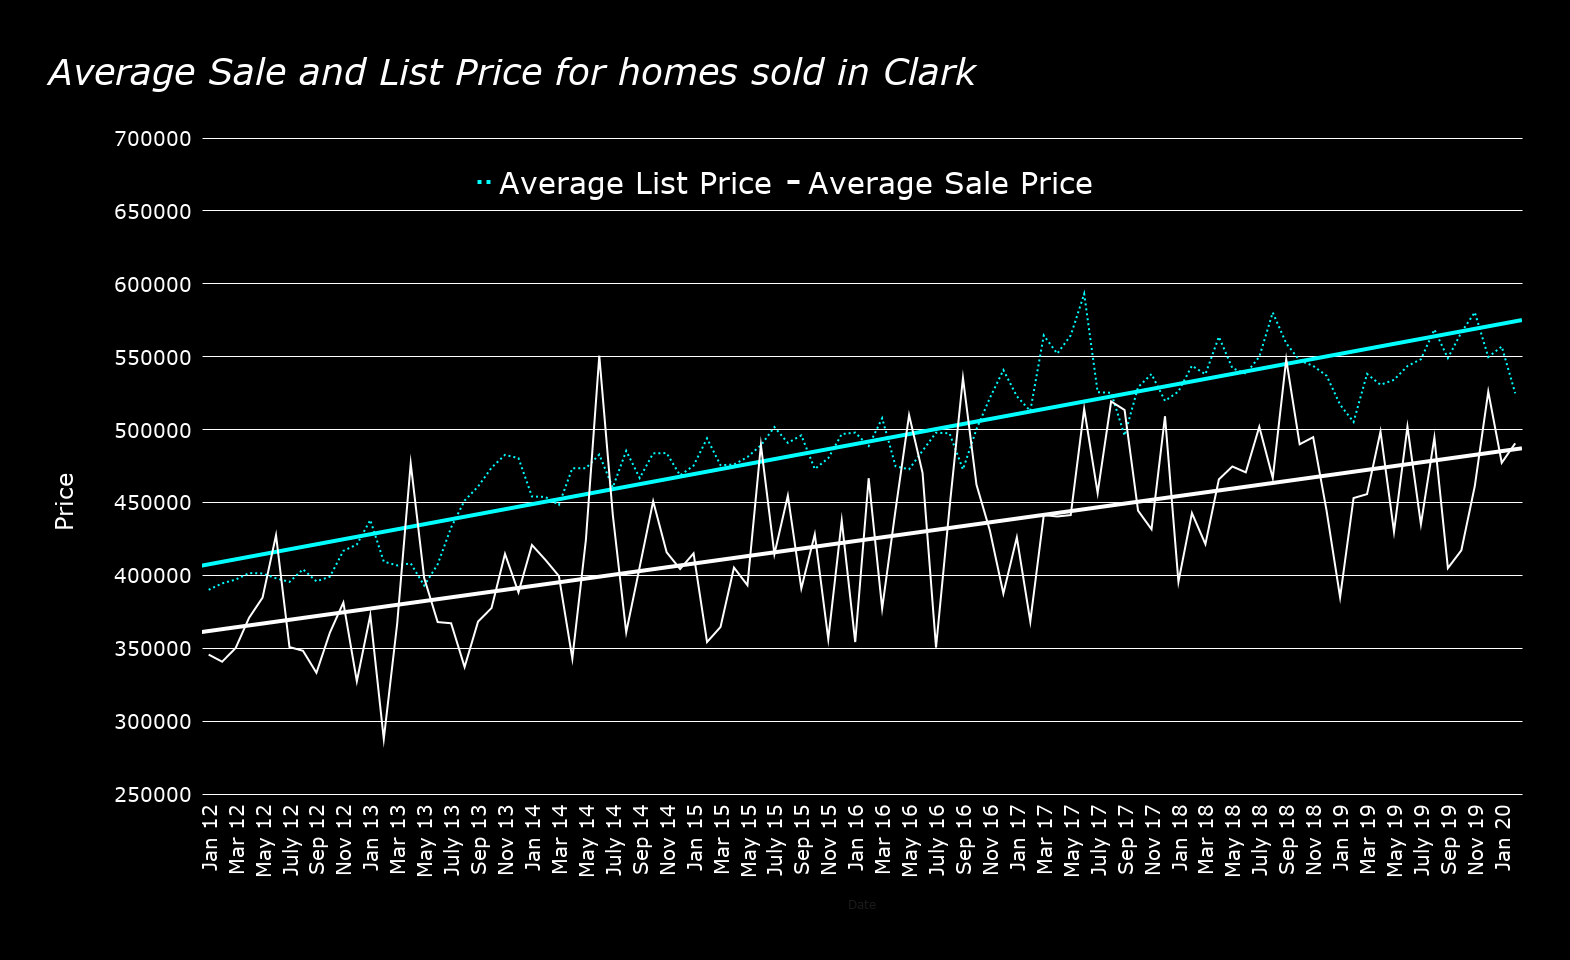
When you look at the graph of home prices in Clark, it’s obvious that there are tremendous variations from month to month. As a rule, prices are higher in the summer and lower in the winter due to supply and demand, but of course there are exceptions to this rule. One exception is extreme homes – those that sell for far below or far above the typical home sale in Clark. Short sales, foreclosures and homes in disrepair often sell for less than market average. The important thing to note in the graph are the straight lines which represents the long term trend, eliminating the seasonal variability and the variability brought on from extreme cases. The trend line continues to show a healthy improvement in prices in Clark over the past 7 years and the forecast is for prices to continue to increase. Homeowners are likely to see an increased return on investment as time goes on.
Days on Market:
One of the questions we’re asked most often is how long it takes to sell a home in Clark. The average sold home in Clark in February was sold after 47 days on the market, noticably faster than the 73 days it took to sell a house in February of 2019. Is the spring market starting early?
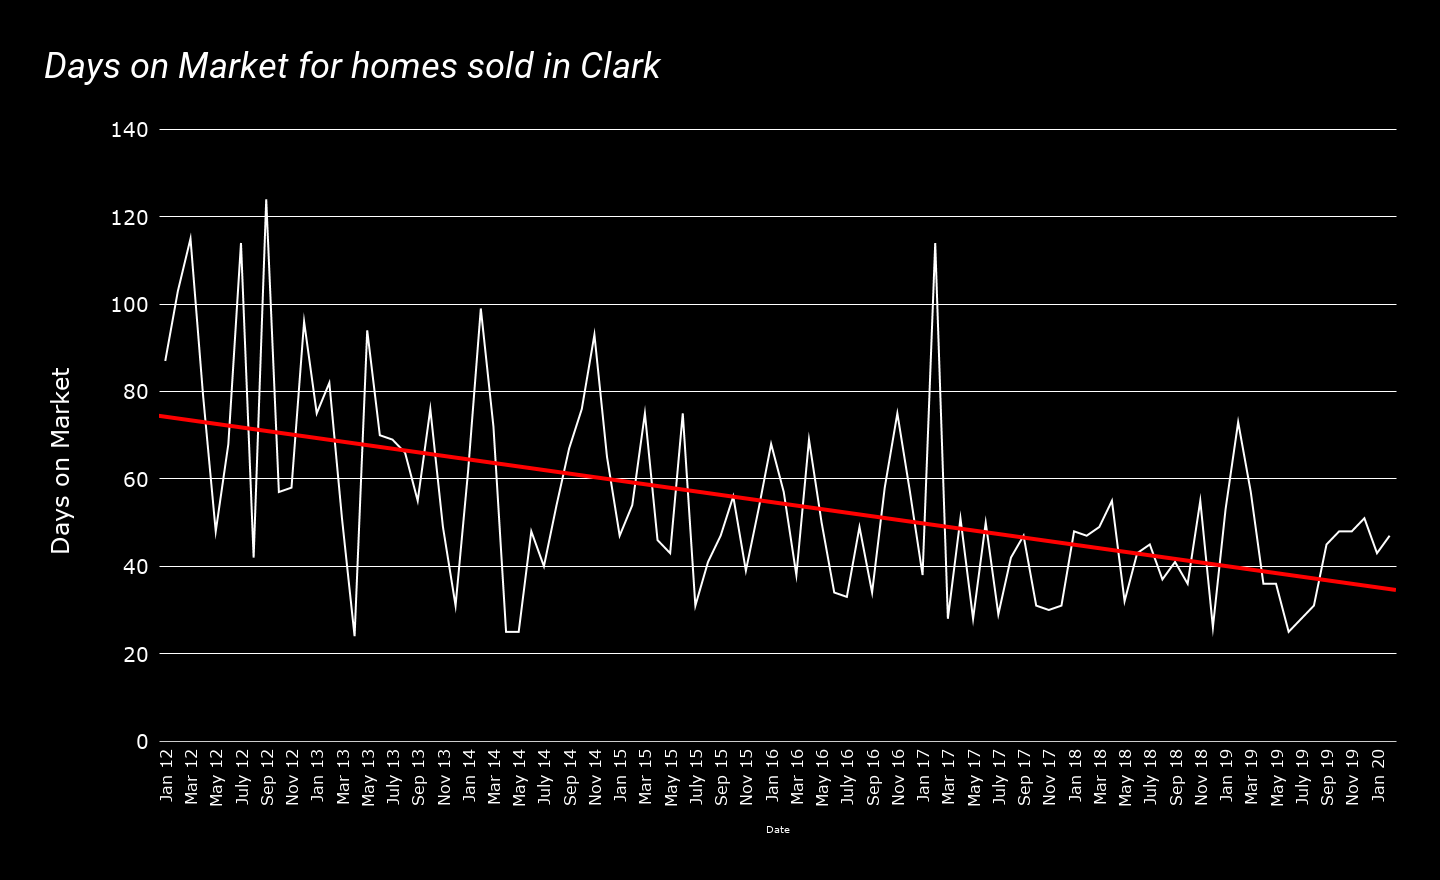
Of course, there are exceptions to this rule and the graph’s dramatic variations are indicators of this. Seasonal variability often results in longer DOM in winter and shorter in summer, but the overall trend line above eliminates that seasonal variability.
Homes sell faster when they are:
- In pristine updated condition,
- Are marketed aggressively, and
- Are priced correctly.
Please visit Team Zuhl’s Clark Real Estate page by clicking here to learn what this means for buyers and sellers!
To read more about the real estate market in Clark, please read our earlier market reports here. For more information on how Team Zuhl can help you, please click here or call us at 908-917-4189.