

If you own a home in Fanwood, or if you want to own a home in Fanwood, this is the place to be for information about real estate values this summer.
Inventory: There are currently 42 single family homes are currently offered for sale in Fanwood which is a little high for this time of year – October 2015 had an inventory of 40 homes and October of 2014 had an inventory of 38 homes. The current listings range in price from $249,900 to $799,000. Nine homes were sold in October at an average sale price of $451,111.
This graph shows inventory and sales for the past 4 years.
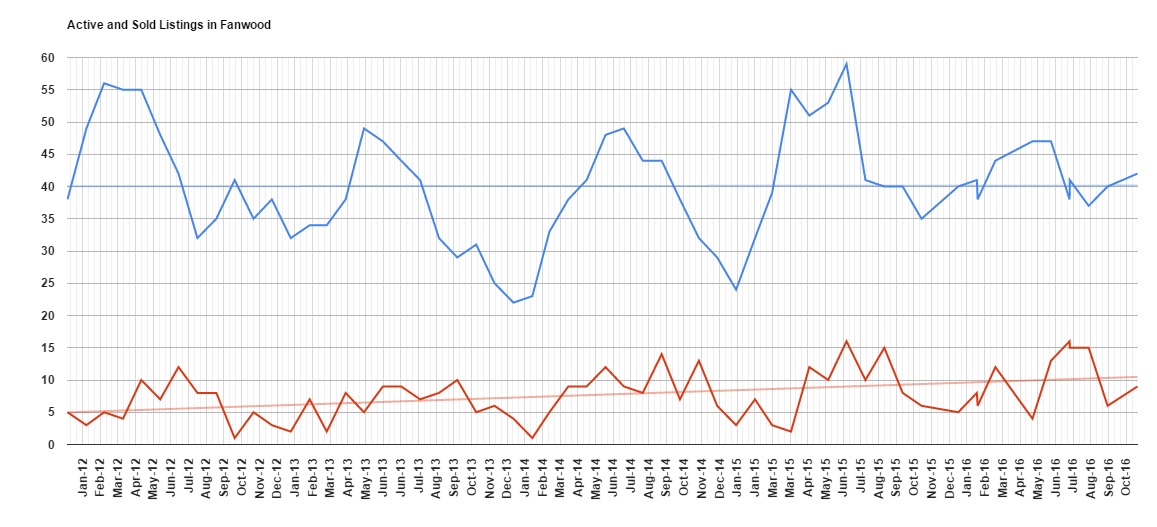
The blue line represents the active inventory in Fanwood month by month. There are seasonal trends with inventory typically increasing in the summer and decreasing each winter. This summer’s inventory never hit the peak that previous years experienced, largely because homes in Fanwood were selling so quickly that the inventory didn’t have a chance to accumulate.
When we look at the trend line for inventory – that’s the darker blue straight line on the graph – we see inventory hasn’t changed measurably over the past 4 years.
The red line at the bottom of the graph shows the number of sold listings over the past 4 years showing a 100% increase over time. In other words, twice as many homes are being sold now per month than was typical four years ago.This is a part of the explanation for the steady inventory seen in Fanwood – more homes are being listed but more are also being sold so there is no net change in inventory.
Prices: In October of 2016, the average sold home was sold for $451,111, slightly up from the previous month and about 2% higher than the 12 month average of $441,704.
The law of supply and demand would predict that steady inventory would result in steady prices but that’s not what we see in Fanwood. At least in part, this is explained by the relatively low number of homes sold per month. When there is a small number of homes, even one outlier can affect the average a great deal.
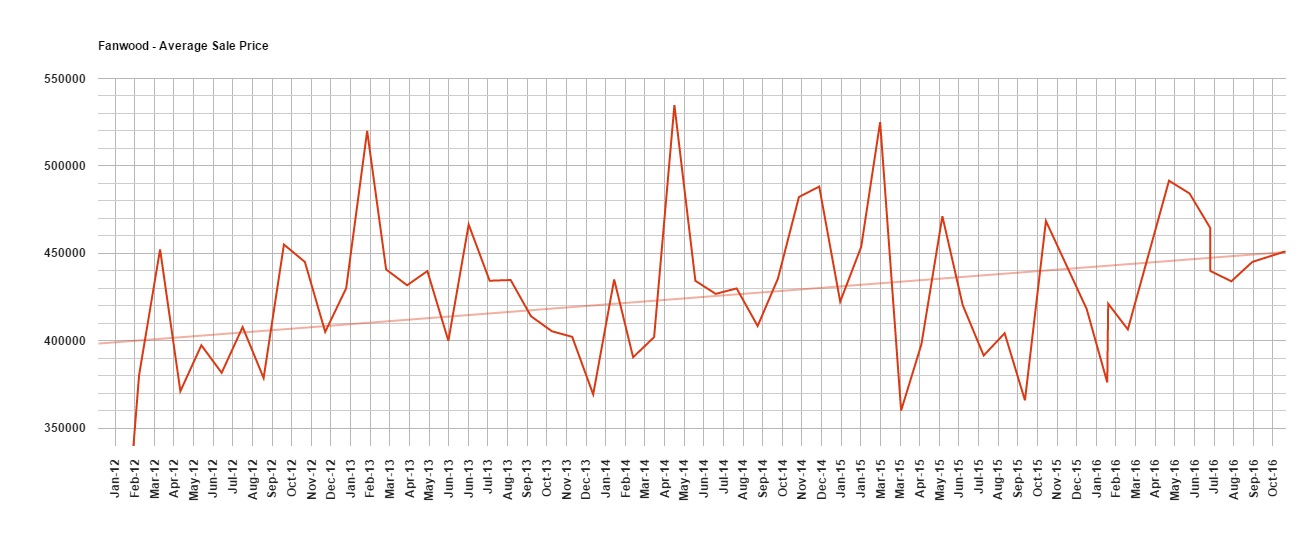
The graph for Fanwood sale prices confirms this variability. What’s good to note is the trend line which is that straight light red line in the graph. It is showing a very healthy increase in prices over the past several years. Prices 4 years ago were around $400,000 and now they’re closer to $450,000 – a 12.5% increase over 4 years.
Days on Market: Of course, the length of time it takes to sell a home depends on far more than just location. It is also dependent on price, condition, and marketing.
In October of 2016, the average sold home in Fanwood was sold after 28 days. This is exceptionally fast for this time of year and exceptionally fast for Union County. October 2015 saw home sales taking 79 days and October 2014 home sales averaged at 60 days.
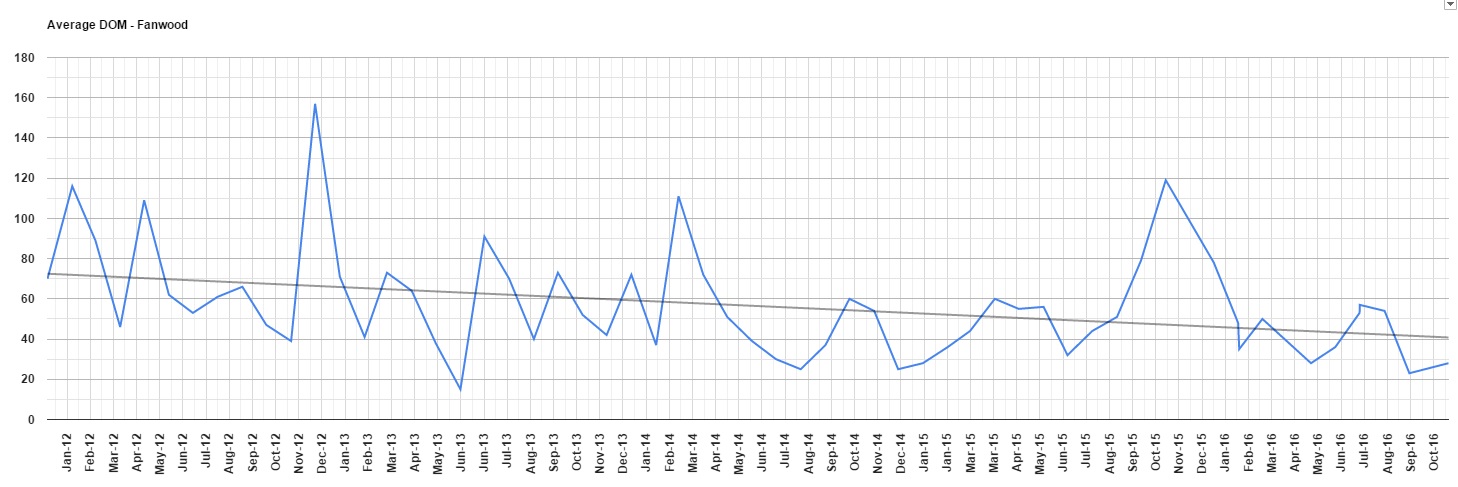
You can see on the graph that home sales in Fanwood aren’t just fast but they’re also getting faster.Looking at the trend line – the black straight line on the graph- homes in Fanwood homes sold back in January of 2012 after about 71 days on the market and now they’re selling significantly faster than that, trending at around 40 days.
If your next step is selling your Fanwood home, call us today at 908-917-4198 for your free comparative market analysis and see how your home compares to others in Fanwood.